Key information
Publication type: General
Publication date:
Contents
5 sections
Overview
This background paper from the London Assembly Research Unit provides information on the finances of Transport for London (TfL).
It includes a series of visualisations of financial data on TfL income and expenditure, both capital and revenue, from 2011-12 to 2024-25. This page presents selected visualisations form the paper.
Data tables are also published in a spreadsheet available from this page.
Total funding
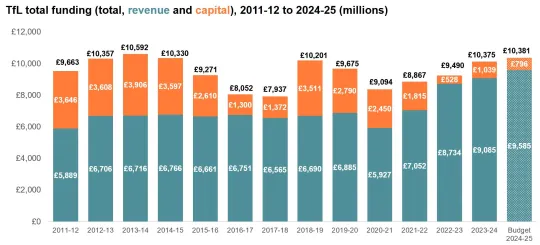
This chart shows total funding sources over 2011-12 to 2023-24 and projected total funding sources for 2024-25. Total revenue sources include all grants, including government grants and retained business rates and the council tax precept, as well fares income, and other operating income. Total capital sources includes Crossrail funding sources including, capital grants and third-party contributions, borrowing and capital receipts. It does not include revenue contributions to capital or use of reserves.

Sources: TfL annual reports and quarterly performance reports; Mayor's final 2024-25 budget and capital spending plan
Fares income
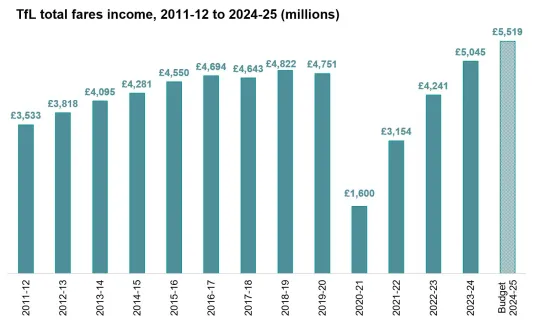
Fares income is TfL’s largest source of income. Fares income increased every year from 2011-12 to 2016-17, before a slight decrease in 2017-18. It then increased again in 2018-19, before decreasing due to the Covid-19 pandemic from 2019-20. The Mayor is responsible for setting the general level and structure of TfL fares.

Sources: TfL annual reports and quarterly performance reports; Mayor's final 2024-25 budget and capital spending plan
Operating costs
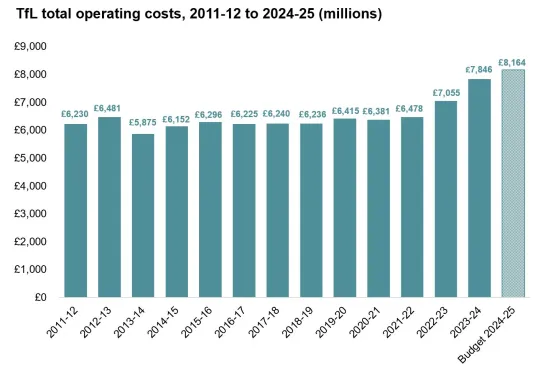
This chart shows TfL’s total operating costs between 2011-12 and 2023-24 and projected operating costs for 2024-25. TfL’s delivery of new services and operations, such as the Elizabeth line and Ultra Low Emission Zone will account for some of the increase in operating costs.

Sources: TfL annual reports and quarterly performance reports; Mayor's final 2024-25 budget and capital spending plan
Capital expenditure
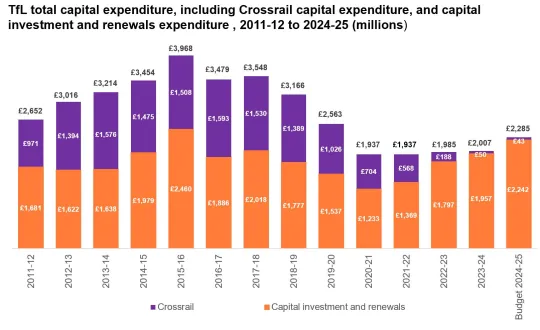
This chart shows TfL's total capital expenditure from 2011-12. It includes expenditure on Crossrail, which is also highlighted separately.

Sources: TfL annual reports and quarterly performance reports; Mayor's final 2024-25 budget and capital spending plan
Related documents
TfL finances 2011-12 to 2024-25 final.pdf
Data tables and notes