Key information
Publication type: General
Publication date:
Contents
4 sections
Overview
This data analysis, produced by the London Assembly Research Unit, provides an overview of road usage and the infrastructure of roads across London. It brings together data on the structure and management of the road network, vehicle and bicycle use, congestion levels and journey purposes. The report also explores issues relating to road condition, pollution and travel behaviour.
The information presented in the report is based on published data from a range of sources, including Department for Transport (DfT), Transport for London (TfL), London Datastore and the Office for National Statistics (ONS).
The analysis was undertaken in support of the London Assembly Transport Committee’s upcoming investigation into road space, driving and congestion in London.
This page presents highlights from the report, with the full document available from the link below.
Road network
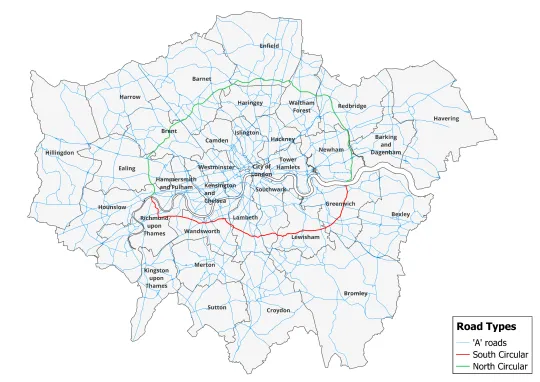
A-roads are key routes in London, marked with an 'A', that connect districts within the city and link to the national road network. Some, known as radial A-roads, run from the outer boroughs into central London. Others are orbital routes, such as the North Circular (A406) and South Circular (A205), which loop around the city centre to help traffic bypass the busiest central areas and lessen the strain on central routes.
A-roads in London

Transport for London (TfL), Strategic Road Network (SRN) – GIS Layer, Updated 2023
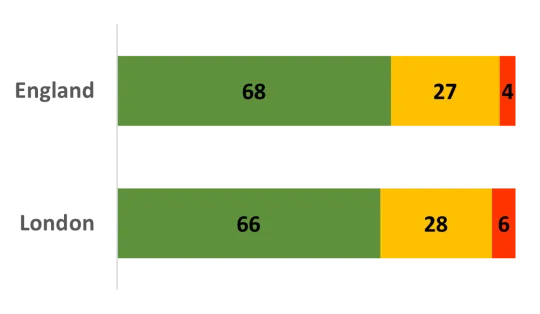
The Department for Transport (DfT) publishes data on the condition of roads, based on local authority assessments. The data shows that London roads are generally in a slightly worse condition than the national average, although there is variation between boroughs.
Proportion of major roads assessed as ‘Green’, ‘Amber’ or ‘Red’, 2024 (%)

Department for Transport (DfT), Road conditions in England to March 2024, December 2024. See RDC0122 for map data. Major roads are A-roads or motorways.
Vehicles and road usage
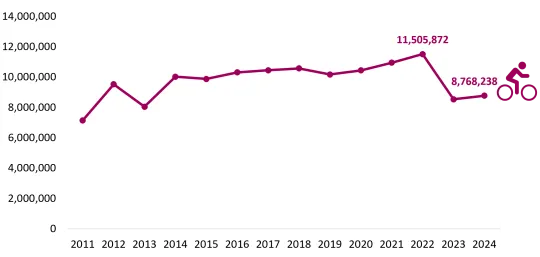
Data from TfL provides information on TfL’s cycle hire scheme (Santander Cycles). Santander bicycle hires in London increased steadily from 2011, reaching a peak of more than 11 million in 2022 but Santander Cycle hires have declined in recent years. TfL’s Travel in London 2024 report suggests that private dockless cycle operators in London collectively supply four to five times more cycles than TfL’s Santander Cycle scheme.
Annual bicycle hires in the Santander Hire Scheme, 2011 - 2024

London Datastore, TfL Number of Bicycle hires of the Santander Cycle Hire Scheme, accessed on 28 July 2025
TfL releases data on the number of taxi and private hire vehicles licensed for use in London. While taxi numbers have gradually reduced in recent years, private hire vehicles (also known as minicabs) have increased significantly.
Number of taxi and private hire vehicles licensed by TfL

Transport for London, Licensing information, accessed 30 July 2025
People and travel purpose
The National Travel Survey found that in 2023, the most common purpose for travelling in London was for leisure, accounting for 25% of all trips, followed by commuting (18%), education or escort education (17%) and shopping (17%).
Proportion of trips per person by purpose, 2023
Department for Transport, National Travel Survey 2023, National Travel Survey combined authority estimates, NTS0409_CA. Escort trips are when the traveller has no purpose of their own, other than to escort or accompany another person; for example, taking a child to school. Personal business refers to visits to services, for example hairdressers, launderettes, dry-cleaners, betting shops or solicitors. Just walk refers to walking trips for pleasure or exercise along public highways, including taking the dog for a walk and jogging.
The Mayor’s Transport Strategy aims to reduce daily car trips by three million and cut car ownership in London by 250,000 by 2041. In 2023, car ownership levels varied across London. Outer London boroughs had the highest number of licensed cars while inner London boroughs had much lower totals.
Number of cars licensed across London boroughs, 2023 (in thousands)
London datastore, Number of Licensed Vehicles by type (2009-2023), September 2024. Original publisher: DVLA/ Department for Transport. Data was taken from DfT tables VEH1104 and VEH0105
Related documents
Road usage and infrastructure data pack