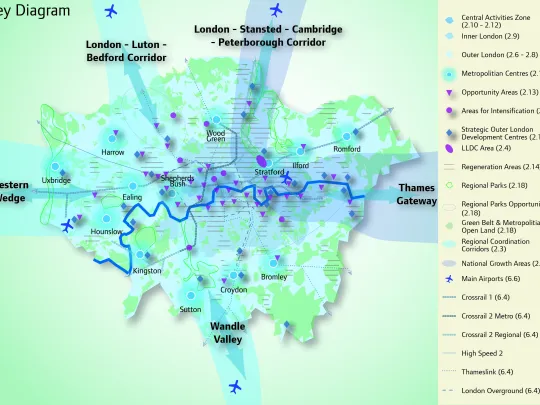
Chapter 2: The Key Diagram
The Key Diagram
2.90 The Key Diagram brings together the main components of the spatial strategy of this Plan outlined above. It shows the emphasis upon growth within the existing London boundary while protecting the Green Belt and open spaces, and with policy and transport linkages in the main development corridors into the surrounding regions. It outlines growth areas of national importance: Thames Gateway and London-Stansted-Cambridge-Peterborough, as well as those of importance to the wider south east: London-Luton-Bedford; Wandsworth-Croydon-Crawley (‘Wandle Valley’) and the Thames Valley/’Western Wedge’. The Central Activities Zone is highlighted together with the Metropolitan town centres which will be crucial to sustainable communities. The other main spatial categories – opportunity areas, areas for intensification, and areas for regeneration – are shown diagrammatically. The Key Diagram also includes the largest new transport proposals and existing airports. The Key Diagram should be looked at in conjunction with Map 2.2 (Outer, Inner, CAZ), Map 2.4 (Opportunity and Intensification Areas), Map 2.5 (Regeneration Areas), and Map 2.6 (Town Centres).

Need a document on this page in an accessible format?
If you use assistive technology (such as a screen reader) and need a version of a PDF or other document on this page in a more accessible format, please get in touch via our online form and tell us which format you need.
It will also help us if you tell us which assistive technology you use. We’ll consider your request and get back to you in 5 working days.