Mayor of London logo London Assembly logo
Home
London Assembly

New drug death data by London borough proves it: drug policy is killing us

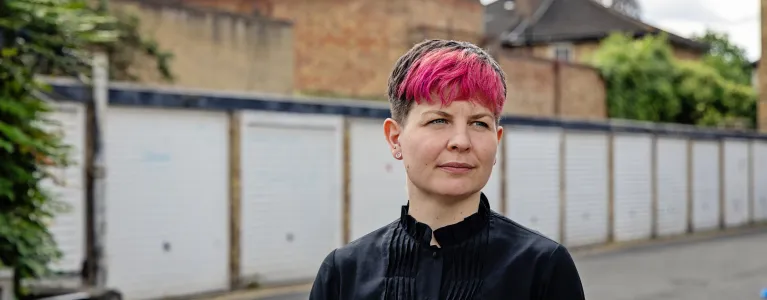
Zoë Garbett stands in a London alley in front of garages. The garages are painted white. Zoë is unsmiling.
Created on
23 October 2024

Data published today from the Office of National Statistics (ONS) of the 2023 figures for deaths related to drug poisoning and misuse in England and Wales painted a horrific picture of rising drug deaths in London.  

Toplines from the ONS data include:  

  • A rise in deaths related to drug poisoning from 84.4 deaths per million or 4,907 deaths in 2022 to 93.0 deaths per million people or 5,448 deaths in 2023.  

  • Over double the rate of drug deaths in men, with a rate of 127.6 deaths per million compared to 59.8 deaths per million among females.  

  • Double the rate of drug-poisoning deaths since 2012, when the rate was 46.5 deaths per million compared to the 2023 rate of 93.0 deaths per million. 

Additionally, Table 1 illustrates a borough-by-borough breakdown of deaths by drug misuse.  

Emphasising how miserably drug policies are failing Londoners, Green Party London Assembly Member Zoë Garbett remarked: 

“Every drug death is preventable.   

“Despite the billions government has spent on drug enforcement, deaths are still rising, drugs are still readily available, and the supply is more toxic and likely to get worse.  

“If we want to put a stop to drug deaths in our communities, the Mayor must listen to science, listen to advocates, and most importantly listen to drug users and support the legalisation and regulation of drugs in London.   

“I know today’s latest death numbers can be abstract, but this data shows more lives ruined, more families destroyed, and more communities ravaged by an epidemic that is entirely within our control.” 

Table 1: Number of deaths related to drug misuse, persons by local authority, registered in each year between 2013 and 2023 


2023 

2022 

2021 

2020 

2019 

2018 

2017 

2016 

2015 

2014 

2013 

All London 

360 

336 

294 

296 

338 

314 

215 

282 

298 

226 

203 

Inner London 

185 

175 

139 

150 

180 

148 

137 

152 

166 

123 

114 

Camden 

14 

15 

11 

14 

18 

16 

21 

16 

15 

11 

13 

City of London 

Hackney  

20 

14 

16 

20 

16 

20 

14 

Hammersmith and Fulham  

10 

32 

28 

11 

Haringey 

21 

14 

11 

10 

10 

24 

13 

Islington 

11 

21 

13 

17 

10 

12 

18 

10 

Kensington and Chelsea 

11 

Lambeth  

17 

21 

24 

16 

16 

14 

14 

21 

Lewisham  

19 

16 

11 

20 

18 

13 

11 

Newham  

11 

13 

10 

10 

14 

Southwark 

22 

20 

13 

18 

15 

14 

13 

13 

12 

10 

Tower Hamlets 

14 

13 

10 

13 

15 

11 

Wandsworth 

13 

Westminster 

10 

11 

10 

17 

12 

16 

13 

13 

Outer London 

175 

161 

155 

146 

158 

166 

78 

130 

132 

103 

89 

Barking and Dagenham 

Barnet 

13 

12 

14 

Bexley 

10 

11 

Brent  

14 

14 

10 

11 

Bromley 

14 

13 

12 

Croydon 

12 

17 

12 

13 

Ealing 

18 

16 

12 

19 

20 

19 

13 

13 

Enfield 

10 

11 

Greenwich 

12 

10 

10 

12 

12 

10 

Harrow 

Havering 

Hillingdon 

12 

13 

15 

10 

10 

27 

10 

Hounslow 

19 

18 

11 

18 

Kingston upon Thames 

Merton 

Redbridge 

10 

11 

Richmond upon Thames 

Sutton 

12 

12 

Waltham Forest 

16 

Notes to editors

The 23 October data release from the ONS can be found here. The 23 October data release broken down by local authority can be found here. Please note, per the ONS, figures for drug misuse and for specific substances are underestimates. 

Need a document on this page in an accessible format?

If you use assistive technology (such as a screen reader) and need a version of a PDF or other document on this page in a more accessible format, please get in touch via our online form and tell us which format you need.

It will also help us if you tell us which assistive technology you use. We’ll consider your request and get back to you in 5 working days.