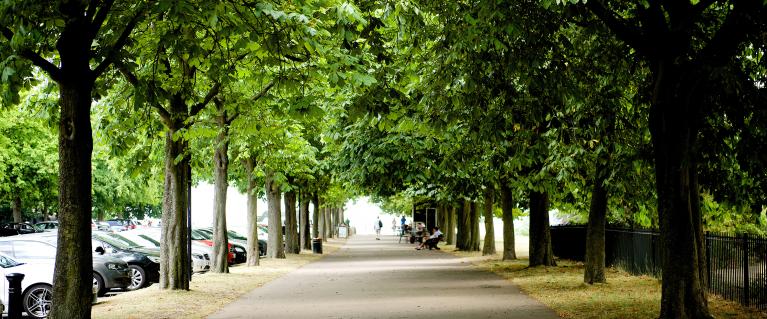
London tree map
The London Tree Map shows the locations and species information for over 880,000 of London's trees. These are predominantly street trees, but also some trees in parks and other open spaces. The map does not represent the entirety of the capital's urban forest - the London iTree report estimated that there are over eight million trees in London, which includes trees in woodlands, parks, streets, private gardens and more. You can see the distribution of tree canopy across the city on our canopy cover map. The map also only contains data from 26 of London's 33 boroughs, the City of London and Transport for London.
As recognised in the London Urban Forest Plan, collating data about London's urban forest is challenging due to the number of landowners and managers involved, as well as the limited resources available. The Plan committed to undertaking regular updates to this map, and also, over time, to collating a London-wide inventory of publicly owned and managed trees, in line with emerging national standards.
The initial data for this map was provided in 2014-15, with a partial update in January 2021. There is more explanation of the data below the map, and the data is available on the London Datastore.
This data is also used by TreeTalk, which allows you to explore London's forest further and create tree walks near you.
- The map includes data from 26 of the London boroughs, the City of London and Transport for London (TfL). TfL trees are shown London-wide.
- Data has not been received to date from six boroughs. We aim to add any additional data received to the Datastore and online map.
- Some large gaps on the map are due to large green spaces (including the Royal Parks), reservoirs, or airports, as well as those boroughs where data is missing.
- The data on the map includes data provided in 2014-15, and updated data provided in 2019-20. Where boroughs did not provide updated data in 2019-20, the 2014-15 data has been retained. However trees may have been surveyed some time before this and so some records may be several years old.
- The data received varied significantly by borough. Some boroughs have only included trees on highways, whilst others have included trees on housing land, in schools or in parks. In some cases trees were recorded only when work was carried out.
- There is not a consistent or agreed format for collecting or recording tree data across London. This presents a challenge in collating data across multiple boroughs. Many boroughs collect a range of information about their trees (e.g. age, height). However this varied by borough in terms of the information collected and categorisations used so we were not able to standardise this information.
- Tree species data has been standardised the names to come up with a simplified common name for display on the tree webmap (e. g. “Pear”). These are the common names for the 24 types of tree appearing most frequently in the data (which encompass 90% of all trees), with the remaining trees categorised as “Other”. We have also left the species name as provided by the borough in the data.
- The ‘tree ID’ number has been added to the data to help map it. This number is not linked to borough’s tree management systems.
Need a document on this page in an accessible format?
If you use assistive technology (such as a screen reader) and need a version of a PDF or other document on this page in a more accessible format, please get in touch via our online form and tell us which format you need.
It will also help us if you tell us which assistive technology you use. We’ll consider your request and get back to you in 5 working days.